

One of the biggest mistakes beginner traders make is focusing too much on entry signals and not enough on market structure.
A perfect candlestick pattern means very little if it appears in the wrong market environment. Likewise, a strong support level can fail if the overall structure remains bearish.
This is why professional traders often analyze market structure before considering any trade.
Market structure reveals who currently controls the market:
- Buyers
- Sellers
- Or neither side
Understanding market structure helps traders align themselves with the dominant market force instead of fighting against it.
In this guide, you’ll learn:
- What market structure is
- The difference between bullish and bearish structure
- How to identify higher highs and lower lows
- Why market structure matters
- Common mistakes beginners make
- How professional traders use structure analysis
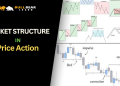
What Is Market Structure?
Market structure refers to the overall pattern of price movement on a chart.
Instead of focusing on individual candles, market structure looks at how price creates:
- Highs
- Lows
- Swing points
These swing points reveal whether buyers or sellers currently control the market.
At its core, market structure answers one simple question:
Is the market moving up, down, or sideways?
Once this question is answered, traders can make more informed decisions.
Why Market Structure Matters
Market structure is one of the most reliable tools in technical analysis because it is based directly on price action.
Unlike indicators, which often lag behind price, structure shows what the market is doing right now.
Market structure helps traders:
- Identify trends
- Filter low-quality setups
- Improve entry timing
- Avoid trading against momentum
- Recognize possible reversals
Many professional traders build entire trading strategies around market structure.
Understanding Swing Highs and Swing Lows
Before identifying structure, you must understand swing points.
What Is a Swing High?
A swing high is a peak where price stops rising and begins moving lower.
It represents an area where sellers entered the market.
Swing highs often become future resistance levels.
What Is a Swing Low?
A swing low is a valley where price stops falling and begins moving higher.
It represents an area where buyers entered the market.
Swing lows often become future support levels.
These highs and lows form the building blocks of market structure.
What Is Bullish Market Structure?
Bullish market structure occurs when buyers control the market.
Price consistently creates:
- Higher Highs (HH)
- Higher Lows (HL)
This pattern indicates growing demand and increasing buyer strength.
How Bullish Structure Forms
A typical bullish sequence looks like this:
- Price creates a high.
- Price pulls back.
- The pullback forms a higher low.
- Buyers push price above the previous high.
- A new higher high is created.
When this process repeats, the market remains bullish.
Characteristics of Bullish Market Structure
Bullish structure often displays:
- Strong upward momentum
- Limited pullbacks
- Rising support levels
- Buyer dominance
During a bullish market, traders generally focus on buying opportunities rather than selling.
The goal is to trade with the trend instead of against it.
What Is Bearish Market Structure?
Bearish market structure occurs when sellers control the market.
Price consistently creates:
- Lower Highs (LH)
- Lower Lows (LL)
This pattern indicates increasing selling pressure.
How Bearish Structure Forms
A typical bearish sequence looks like this:
- Price creates a low.
- Price retraces upward.
- The retracement forms a lower high.
- Sellers push price below the previous low.
- A new lower low is created.
When this sequence continues, the market remains bearish.
Characteristics of Bearish Market Structure
Bearish structure often displays:
- Strong selling momentum
- Weak rallies
- Falling resistance levels
- Seller dominance
During bearish conditions, traders often prioritize short-selling opportunities.
Bullish Structure vs Bearish Structure
Understanding the difference is essential.
Bullish Structure
Features:
- Higher highs
- Higher lows
- Rising trendline
- Strong support
Market sentiment:
- Optimistic
- Buyer-driven
Trading focus:
- Buy pullbacks
- Follow trend continuation
Bearish Structure
Features:
- Lower highs
- Lower lows
- Falling trendline
- Strong resistance
Market sentiment:
- Negative
- Seller-driven
Trading focus:
- Sell rallies
- Follow downward momentum
Recognizing these differences allows traders to quickly assess market conditions.
What Is a Range Market Structure?
Not all markets trend.
Sometimes price moves sideways between support and resistance.
This creates a range.
Characteristics include:
- Equal highs
- Equal lows
- Lack of trend direction
- Frequent reversals
Range markets often frustrate beginners because trend-following strategies become less effective.
When structure becomes unclear, patience is often the best decision.
How to Identify Market Structure
Identifying structure is easier than many traders think.
Step 1: Zoom Out
Start with higher timeframes.
Recommended charts:
- Daily
- 4-Hour
Higher timeframes reveal cleaner structure.
Step 2: Mark Significant Swing Points
Identify major highs and lows.
Ignore minor fluctuations.
Focus on meaningful market movements.
Step 3: Compare Recent Swings
Ask:
- Are highs increasing?
- Are lows increasing?
- Are highs decreasing?
- Are lows decreasing?
The answers reveal whether the market is bullish or bearish.
Step 4: Confirm the Trend
Use supporting tools such as:
- Trendlines
- Support and resistance
- Moving averages
Confirmation increases confidence in your analysis.
Market Structure Breaks
Market structure does not last forever.
Eventually, trends weaken and reversals occur.
One of the first signs is a structure break.
Bullish Structure Break
In a bullish trend:
- Higher lows fail
- Previous swing lows break
This suggests buyers may be losing control.
Bearish Structure Break
In a bearish trend:
- Lower highs fail
- Previous swing highs break
This suggests sellers may be weakening.
Structure breaks often signal changing market conditions.
However, traders should wait for confirmation before assuming a reversal.
Market Structure and Support & Resistance
Market structure becomes even more powerful when combined with support and resistance.
Example:
A bullish higher low forms at a major support zone.
This creates confluence.
The combination of:
- Support
- Market structure
- Trend direction
often produces higher-probability setups.
Market Structure and Candlestick Analysis
Candlestick patterns should always be interpreted within the context of market structure.
For example:
Strong Bullish Setup
- Uptrend
- Higher low
- Support level
- Bullish engulfing candle
This combination is often stronger than the candlestick pattern alone.
Strong Bearish Setup
- Downtrend
- Lower high
- Resistance level
- Bearish engulfing candle
This alignment increases the quality of the setup.
Common Market Structure Mistakes
Focusing on Small Timeframes
Many beginners analyze 1-minute and 5-minute charts.
These charts contain excessive noise.
Higher timeframes often provide more reliable structure.
Ignoring Context
A higher high alone does not guarantee a bullish market.
Always analyze the overall structure.
Predicting Reversals Too Early
Many traders attempt to catch tops and bottoms.
Wait for confirmation before assuming a trend has changed.
Trading Against Structure
Trading against clear market structure often leads to unnecessary losses.
The path of least resistance is usually the better choice.
Practical Market Structure Checklist
Before entering a trade, ask:
✓ Is the market bullish, bearish, or ranging?
✓ Are higher highs and higher lows present?
✓ Are lower highs and lower lows present?
✓ Is price near support or resistance?
✓ Does the candlestick pattern support the trade?
✓ Does the higher timeframe agree?
If multiple factors align, the trade may offer a stronger probability.
How Professional Traders Use Market Structure
Professional traders often follow a simple process:
- Determine overall market structure.
- Mark support and resistance.
- Identify trend direction.
- Wait for pullbacks.
- Look for confirmation signals.
- Execute trades with proper risk management.
Notice that entry signals come later.
Structure analysis always comes first.
Final Thoughts
Market structure is one of the most important concepts in Forex trading.
By understanding higher highs, higher lows, lower highs, and lower lows, traders can identify who currently controls the market and avoid trading against momentum.
Remember:
- Bullish structure = higher highs and higher lows.
- Bearish structure = lower highs and lower lows.
- Range structure = sideways movement.
Mastering market structure will improve your chart-reading skills and provide a strong foundation for more advanced trading concepts such as Break of Structure (BOS), Market Structure Shift (MSS), Smart Money Concepts, and Price Action trading.
Related Articles
- What Is Technical Analysis in Forex?
- How to Read Forex Charts
- Support and Resistance Explained
- Trendlines in Forex Trading
- How to Identify Market Trends
- Candlestick Basics for Beginners
FAQ
What is market structure in Forex?
Market structure is the pattern of highs and lows created by price movement, helping traders identify trends and market direction.
What is bullish market structure?
Bullish market structure occurs when price forms higher highs and higher lows, indicating buyer control.
What is bearish market structure?
Bearish market structure occurs when price forms lower highs and lower lows, indicating seller control.
Why is market structure important?
Market structure helps traders identify trends, improve timing, and avoid trading against market momentum.
Can market structure predict reversals?
Market structure can provide early warning signs of potential reversals, but confirmation is always necessary before making trading decisions.


