

One of the most common reasons traders lose money is trading against the trend.
Many beginners focus on finding entry signals while ignoring the overall market direction. As a result, they often buy in a falling market or sell in a rising market.
Professional traders approach the market differently. Before considering any trade, they first determine the trend.
There is a popular saying among traders:
The trend is your friend.
While trends do not last forever, trading in the direction of the prevailing trend generally offers a higher probability of success than fighting against it.
In this guide, you’ll learn:
- What a market trend is
- The three types of market conditions
- How to identify trends using price action
- Tools that help confirm trends
- Common mistakes beginners make
- A practical trend analysis process
What Is a Market Trend?
A market trend is the general direction in which price moves over a period of time.
Although price constantly fluctuates, markets usually move in one of three conditions:
- Uptrend
- Downtrend
- Range (sideways market)
Understanding which condition currently exists is the foundation of technical analysis.
Without trend analysis, every trade becomes significantly more difficult.
Why Trend Analysis Matters
Trend analysis helps traders:
- Trade with momentum
- Avoid low-probability setups
- Improve entry timing
- Manage risk more effectively
- Filter out unnecessary trades
Many successful trading strategies are built around one simple principle:
Trade with the trend whenever possible.
By aligning trades with market direction, traders increase their chances of participating in larger price movements.
The Three Types of Market Trends
Before identifying a trend, it’s important to understand the different market conditions.
Uptrend
An uptrend occurs when buyers are in control of the market.
Price forms:
- Higher highs (HH)
- Higher lows (HL)
This structure indicates that buyers are willing to pay increasingly higher prices.
Characteristics of an uptrend include:
- Strong bullish momentum
- Rising trendlines
- Price holding above support levels
In an uptrend, traders typically look for buying opportunities.
Downtrend
A downtrend occurs when sellers dominate the market.
Price forms:
- Lower highs (LH)
- Lower lows (LL)
This indicates that sellers continue pushing the market lower.
Characteristics of a downtrend include:
- Strong bearish momentum
- Falling trendlines
- Price respecting resistance levels
In a downtrend, traders generally focus on selling opportunities.
Range Market
A range occurs when neither buyers nor sellers have clear control.
Price moves sideways between support and resistance.
Characteristics of a range include:
- No clear trend
- Frequent reversals
- Choppy price action
Many beginner traders mistake ranges for trends and enter trades too early.
Understanding the difference is critical.
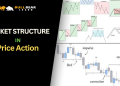
Market Structure: The Most Reliable Trend Indicator
Many traders use indicators to identify trends.
However, price itself often provides the clearest information.
Market structure is the foundation of trend analysis.
Higher Highs and Higher Lows
In a bullish market:
- Each new high exceeds the previous high.
- Each pullback creates a higher low.
This pattern confirms buyer strength.
When this structure remains intact, the uptrend remains valid.
Lower Highs and Lower Lows
In a bearish market:
- New lows continue forming.
- Pullbacks fail to exceed previous highs.
This structure confirms seller control.
As long as lower highs and lower lows continue, the downtrend remains intact.
Using Trendlines to Identify Trends
Trendlines provide a visual representation of market direction.
Uptrend Line
An uptrend line connects higher lows.
As long as price respects the trendline:
- Buyers remain active
- Market structure stays bullish
The trendline acts as dynamic support.
Downtrend Line
A downtrend line connects lower highs.
As long as price remains below the trendline:
- Sellers maintain control
- Market structure stays bearish
The trendline acts as dynamic resistance.
Trendlines work best when combined with price action and support/resistance analysis.
Using Moving Averages to Confirm Trends
Moving averages are among the most popular trend-following indicators.
They help smooth out market noise and reveal the underlying direction.
Price Above the Moving Average
When price remains above a major moving average:
- Market sentiment is generally bullish
- Buyers are controlling the trend
Many traders use:
- 50-period Moving Average
- 100-period Moving Average
- 200-period Moving Average
for trend confirmation.
Price Below the Moving Average
When price remains below the moving average:
- Market sentiment is generally bearish
- Sellers are controlling the market
Moving averages should support your analysis, not replace it.
Multiple Timeframe Trend Analysis
One of the biggest mistakes beginners make is analyzing only one timeframe.
Professional traders often perform top-down analysis.
Step 1: Analyze the Daily Chart
The daily chart reveals the overall market direction.
Ask:
- Is the market bullish?
- Is the market bearish?
- Is the market ranging?
Step 2: Move to the 4-Hour Chart
The 4-hour chart provides more detail.
Look for:
- Market structure
- Trendlines
- Key support and resistance levels
Step 3: Use Lower Timeframes for Entries
Once the higher timeframe trend is clear, lower timeframes can help refine entries.
This approach keeps traders aligned with the dominant market direction.
How to Spot Trend Reversals
Every trend eventually ends.
The challenge is recognizing when a trend is weakening.
Warning Signs of a Reversal
Possible signs include:
- Failure to create new highs
- Failure to create new lows
- Strong rejection candles
- Break of trendline
- Break of market structure
A single signal is rarely enough.
Multiple factors should align before assuming a reversal has occurred.
Trend Strength vs Trend Direction
Trend direction and trend strength are not the same thing.
A market can be:
- Bullish but weak
- Bearish but weak
- Bullish and strong
- Bearish and strong
Strong Trends
Strong trends often display:
- Large momentum candles
- Limited pullbacks
- Clear market structure
Weak Trends
Weak trends often display:
- Frequent retracements
- Smaller candles
- Increased volatility
Understanding trend strength helps traders set realistic expectations.
Common Trend Analysis Mistakes
Trading Against the Trend
Many beginners try to pick tops and bottoms.
This can be extremely risky.
Following the trend is often the safer approach.
Ignoring Higher Timeframes
A setup that appears bullish on a 15-minute chart may actually be bearish on the daily chart.
Always begin with higher timeframes.
Using Too Many Indicators
Indicators should support price action, not replace it.
Overloading a chart often creates conflicting signals.
Confusing Pullbacks with Reversals
Not every pullback means the trend has changed.
Trends naturally retrace before continuing.
Patience is essential.
Practical Trend Analysis Checklist
Before entering a trade, ask yourself:
✓ Is the market trending or ranging?
✓ Are higher highs and higher lows present?
✓ Are lower highs and lower lows present?
✓ Does price respect the trendline?
✓ Does the higher timeframe support the trade idea?
✓ Are support and resistance levels aligned with the trend?
If the answers support one direction, the trade setup may have higher probability.
Simple Trend-Following Workflow
A beginner-friendly process:
Step 1
Open the daily chart.
Identify the overall trend.
Step 2
Mark key support and resistance levels.
Step 3
Draw relevant trendlines.
Step 4
Confirm market structure.
Step 5
Wait for pullbacks rather than chasing price.
Step 6
Look for confirmation before entering.
This simple routine can significantly improve decision-making.
Final Thoughts
Trend identification is one of the most valuable skills a Forex trader can develop.
By understanding market structure, trendlines, support and resistance, and multiple timeframe analysis, traders can avoid many of the mistakes that trap beginners.
Remember:
- Uptrends create higher highs and higher lows.
- Downtrends create lower highs and lower lows.
- Ranges create uncertainty.
Before looking for entries, always identify the trend first.
Doing so can dramatically improve both your confidence and your consistency as a trader.
Related Articles
- What Is Technical Analysis in Forex?
- How to Read Forex Charts
- Support and Resistance Explained
- Trendlines in Forex Trading
- Bullish vs Bearish Market Structure
- Multi Timeframe Analysis Guide
FAQ
What is the easiest way to identify a trend?
The simplest method is analyzing market structure. Higher highs and higher lows indicate an uptrend, while lower highs and lower lows indicate a downtrend.
Which timeframe is best for trend analysis?
Daily and 4-hour charts are generally considered the most reliable for identifying trends.
Can moving averages identify trends?
Yes. Moving averages can help confirm trend direction, but they should be used alongside price action analysis.
How do I know if a trend is ending?
Possible signs include a break of market structure, trendline breaks, and failure to create new highs or lows.
Should beginners trade with the trend?
In most cases, yes. Trading with the trend is generally less risky than attempting to predict reversals.


