
Learning how to read Forex charts is one of the first skills every trader must develop. Before you can identify trading opportunities, spot trends, or apply technical analysis, you need to understand what the chart is telling you.
Fortunately, Forex charts are not as complicated as they appear. Once you understand the basic elements—price, timeframes, candlesticks, and trends—you can begin analyzing the market with confidence.
In this guide, you’ll learn:
- What Forex charts are
- The different types of Forex charts
- How to read candlesticks
- How to identify trends
- Common beginner mistakes
- Practical tips for chart analysis
What Is a Forex Chart?
A Forex chart is a visual representation of how the price of a currency pair moves over time.
Every Forex chart contains two important components:
- Price
- Time
The vertical axis shows price.
The horizontal axis shows time.
As the market moves, the chart records every price change, allowing traders to analyze historical data and identify potential future opportunities.
For example:
- EUR/USD = 1.1000
- GBP/USD = 1.2800
- USD/JPY = 150.00
These prices constantly fluctuate as buyers and sellers enter the market.
Why Forex Charts Matter
Charts are the foundation of technical analysis.
Without charts, traders would have no way to:
- Identify trends
- Find support and resistance levels
- Spot trading opportunities
- Manage risk effectively
Professional traders spend most of their time analyzing charts because price action reflects the collective decisions of millions of market participants.
The Three Main Types of Forex Charts
There are three common chart types used in Forex trading.
1. Line Chart
A line chart connects closing prices over a selected period.
Advantages:
- Simple and clean
- Easy for beginners
Disadvantages:
- Limited information
- Does not show intraday price movement
Line charts are useful for getting a quick overview of market direction.
2. Bar Chart
Bar charts display four pieces of information:
- Open
- High
- Low
- Close
This is often referred to as OHLC data.
Advantages:
- More information than line charts
Disadvantages:
- Harder to read for beginners
Many institutional traders still use bar charts, although they are less popular among retail traders.
3. Candlestick Chart
Candlestick charts are the most widely used chart type in Forex trading.
Each candle displays:
- Opening price
- Closing price
- Highest price
- Lowest price
Because candlesticks visually represent market sentiment, they are easier to interpret than bar charts.
Most technical analysis strategies are based on candlestick charts.
Understanding Candlesticks
Each candlestick tells a story about the battle between buyers and sellers.
A candle consists of:
- Body
- Upper wick
- Lower wick
Bullish Candle
A bullish candle forms when the closing price is higher than the opening price.
This indicates buying pressure.
The larger the bullish candle, the stronger the buyers were during that period.
Bearish Candle
A bearish candle forms when the closing price is lower than the opening price.
This indicates selling pressure.
Large bearish candles often signal strong downward momentum.
Candle Wicks
Wicks represent rejected prices.
Long upper wicks may indicate sellers entering the market.
Long lower wicks may indicate buyers defending lower prices.
Understanding wicks helps traders identify potential reversals and areas of interest.
Understanding Timeframes
A timeframe determines how much time a single candle represents.
Common timeframes include:
- M1 (1 minute)
- M5 (5 minutes)
- M15 (15 minutes)
- H1 (1 hour)
- H4 (4 hours)
- Daily
- Weekly
For example:
On a 1-hour chart, each candle represents one hour of price movement.
On a daily chart, each candle represents one trading day.
Which Timeframe Should Beginners Use?
Many new traders make the mistake of focusing on very small timeframes.
Lower timeframes often contain more noise and false signals.
For beginners:
- Daily chart = best for trend analysis
- H4 chart = swing trading
- H1 chart = trade execution
Starting with higher timeframes makes chart reading easier.
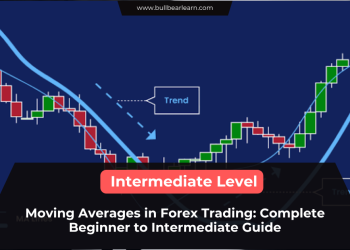
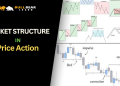
How to Identify Market Trends
One of the most important skills in chart analysis is identifying the trend.
Markets generally move in three directions.
Uptrend
An uptrend consists of:
- Higher highs
- Higher lows
Buyers are in control.
Traders generally look for buying opportunities during an uptrend.
Downtrend
A downtrend consists of:
- Lower highs
- Lower lows
Sellers are in control.
Traders often look for selling opportunities.
Range Market
A ranging market moves sideways.
Price repeatedly bounces between support and resistance levels.
Many beginners lose money because they mistake ranges for trends.
Reading Price Movement
When analyzing a chart, ask yourself these questions:
Is the market trending?
Determine whether price is moving upward, downward, or sideways.
Where are support and resistance levels?
These are areas where price has reacted previously.
Support acts as a floor.
Resistance acts as a ceiling.
What are the candles showing?
Candlestick behavior often reveals who currently controls the market.
Strong bullish candles suggest buyer strength.
Strong bearish candles suggest seller strength.
Is momentum increasing or decreasing?
Momentum helps traders determine whether a move is likely to continue.
Large candles generally indicate strong momentum.
Small candles often suggest indecision.
Example of Basic Chart Analysis
Imagine EUR/USD is showing:
- Higher highs
- Higher lows
- Strong bullish candles
The chart suggests an uptrend.
Next, identify support levels where buyers previously entered.
Instead of buying randomly, traders wait for price to retrace toward support before considering an entry.
This simple process forms the basis of many trading strategies.
Common Mistakes Beginners Make
Looking at Too Many Indicators
Many beginners fill their charts with indicators.
This often creates confusion rather than clarity.
Focus on price first.
Ignoring Higher Timeframes
A setup that looks bullish on a 5-minute chart may be bearish on the daily chart.
Always analyze higher timeframes before entering a trade.
Trading Every Candle
Not every candle is a trading signal.
Successful traders focus on high-quality setups.
Ignoring Market Structure
Understanding trend direction is often more important than finding entry signals.
Never trade against market structure without a strong reason.
Practical Chart Reading Checklist
Before placing a trade, review this checklist:
✓ What is the overall trend?
✓ Is the market trending or ranging?
✓ Where are the nearest support and resistance levels?
✓ What are the candlesticks showing?
✓ Is momentum increasing or decreasing?
✓ Does the setup align with the higher timeframe?
If you cannot answer these questions clearly, it may be best to wait.
Final Thoughts
Learning how to read Forex charts is the foundation of successful trading.
Before studying advanced concepts like indicators, Smart Money Concepts, or algorithmic trading, traders should master chart basics.
Focus on understanding:
- Candlesticks
- Timeframes
- Trends
- Support and resistance
- Market structure
The better you become at reading charts, the easier it will be to identify high-probability trading opportunities and avoid unnecessary mistakes.
Related Articles
- What Is Technical Analysis in Forex?
- Support and Resistance Explained
- Trendlines in Forex Trading
- Candlestick Basics for Beginners
- How to Identify Market Trends
- Multi Timeframe Analysis Guide
FAQ
What is the best chart type for Forex trading?
Candlestick charts are generally considered the best because they provide detailed information about price movement and market sentiment.
Which timeframe is best for beginners?
Daily and 4-hour charts are often easier for beginners because they contain less market noise.
Can I trade using only chart analysis?
Many traders rely primarily on chart analysis, although combining technical and fundamental analysis can provide additional context.
How long does it take to learn chart reading?
Most traders can learn the basics within a few weeks, but developing strong chart-reading skills requires consistent practice and experience.


