
The Moving Average Convergence Divergence (MACD) is one of the most widely used technical indicators in Forex trading.
Unlike simple momentum indicators, MACD helps traders analyze both:
- Trend direction
- Market momentum
This combination makes MACD a favorite among beginner and professional traders alike.
However, many traders misunderstand how MACD works. They focus only on crossover signals while ignoring the broader market context.
As a result, they often enter low-quality trades and experience unnecessary losses.
In this guide, you’ll learn:
- What the MACD indicator is
- How MACD is calculated
- How to read MACD signals
- MACD crossover strategies
- MACD divergence analysis
- Common mistakes to avoid
By the end of this article, you’ll understand how to use MACD effectively as part of a complete trading system.
What Is the MACD Indicator?
MACD stands for:
Moving Average Convergence Divergence
The indicator was developed by Gerald Appel.
MACD is designed to measure:
- Trend strength
- Momentum changes
- Potential reversals
Unlike RSI, which oscillates between fixed values, MACD moves freely above and below a central zero line.
This allows traders to evaluate both trend direction and momentum simultaneously.
Why MACD Is Popular
MACD remains popular because it combines several useful concepts into a single indicator.
Benefits include:
- Trend identification
- Momentum analysis
- Reversal detection
- Entry confirmation
- Easy interpretation
Because MACD is based on moving averages, it works particularly well in trending markets.
Components of the MACD Indicator
MACD consists of three elements.
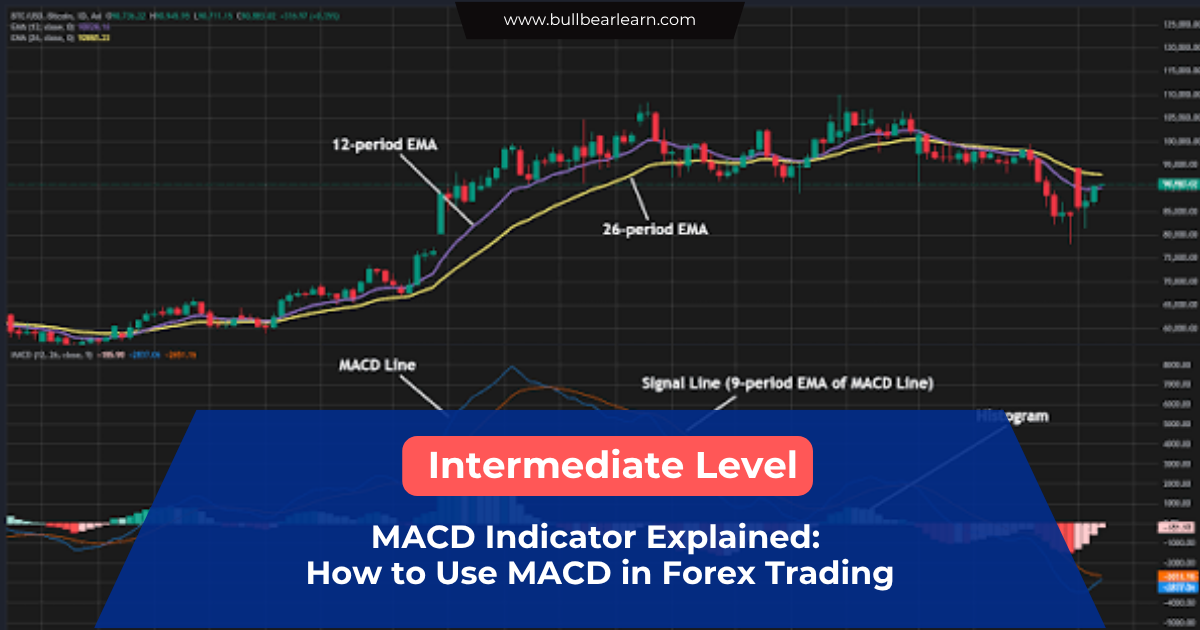
MACD Line
The MACD line represents the difference between two exponential moving averages.
Standard settings use:
- 12-period EMA
- 26-period EMA
The calculation is:
MACD=EMA_{12}-EMA_{26}
This line measures short-term momentum relative to longer-term momentum.
Signal Line
The signal line is typically a:
- 9-period EMA of the MACD line
Its purpose is to smooth fluctuations and generate trading signals.
Histogram
The histogram represents the distance between:
- MACD line
- Signal line
The histogram helps visualize momentum changes.
Larger histogram bars indicate stronger momentum.
Smaller bars suggest weakening momentum.
Understanding the Zero Line
One of the most important concepts in MACD analysis is the zero line.
MACD Above Zero
When MACD is above zero:
- Short-term momentum exceeds long-term momentum
- Market sentiment is generally bullish
This often supports long opportunities.
MACD Below Zero
When MACD is below zero:
- Short-term momentum is weaker than long-term momentum
- Market sentiment is generally bearish
This often supports short opportunities.
The zero line provides a quick snapshot of trend direction.
MACD Crossover Signals
The most popular MACD strategy involves crossovers.
A crossover occurs when the MACD line crosses the signal line.
Bullish MACD Crossover
A bullish crossover occurs when:
- MACD line crosses above signal line
This suggests:
- Increasing bullish momentum
- Potential upward movement
Many traders interpret this as a buy signal.
However, confirmation remains important.
Bearish MACD Crossover
A bearish crossover occurs when:
- MACD line crosses below signal line
This suggests:
- Increasing bearish momentum
- Potential downward movement
Many traders interpret this as a sell signal.
Again, context is critical.
Why MACD Crossovers Can Fail
Many beginners assume every crossover creates a trading opportunity.
This is not true.
During ranging markets:
- MACD crossovers occur frequently
- False signals increase
- Whipsaws become common
This is why professional traders rarely trade crossovers alone.
They combine MACD with other forms of analysis.
MACD Histogram Analysis
The histogram provides valuable information about momentum.
Expanding Histogram
When bars become larger:
- Momentum is increasing
- Trend strength may be growing
This often supports trend continuation.
Contracting Histogram
When bars become smaller:
- Momentum is weakening
- Trend strength may be fading
This can serve as an early warning sign of a slowdown or reversal.
MACD Divergence
Divergence is one of the most powerful MACD concepts.
It occurs when price and MACD move in different directions.
Bullish Divergence
Bullish divergence occurs when:
- Price makes a lower low
- MACD makes a higher low
This suggests:
- Selling pressure is weakening
- A bullish reversal may become possible
Bearish Divergence
Bearish divergence occurs when:
- Price makes a higher high
- MACD makes a lower high
This suggests:
- Buying momentum is weakening
- A bearish reversal may become possible
Divergence should be treated as a warning signal rather than an immediate entry trigger.
MACD and Trend Trading
MACD works particularly well in trending markets.
Bullish Trend Conditions
Characteristics:
- Price above key moving averages
- Higher highs and higher lows
- MACD above zero
These conditions support bullish bias.
Bearish Trend Conditions
Characteristics:
- Price below moving averages
- Lower highs and lower lows
- MACD below zero
These conditions support bearish bias.
Using MACD alongside market structure can improve decision-making.
MACD Pullback Strategy
One popular approach involves trading pullbacks.
Bullish Example
Conditions:
- Strong uptrend
- Temporary pullback
- MACD remains above zero
- Bullish crossover appears
This may provide a continuation setup.
Bearish Example
Conditions:
- Strong downtrend
- Temporary rally
- MACD remains below zero
- Bearish crossover appears
This may provide a continuation opportunity.
This strategy focuses on trading with the trend rather than predicting reversals.
Combining MACD with Price Action
Professional traders often use MACD as a confirmation tool.
Common combinations include:
- Support and resistance
- Trendlines
- Market structure
- Supply and demand zones
- Candlestick patterns
For example:
A bullish engulfing candle forming at demand while MACD turns bullish often provides stronger confirmation than either signal individually.
This concept is known as confluence.
MACD vs RSI
MACD and RSI are often compared.
However, they serve different purposes.
MACD
Best for:
- Trend identification
- Momentum analysis
- Trend-following strategies
RSI
Best for:
- Overbought conditions
- Oversold conditions
- Momentum exhaustion
Many traders use both indicators together.
The indicators can complement one another rather than compete.
Best MACD Settings
The standard MACD settings are:
- Fast EMA: 12
- Slow EMA: 26
- Signal Line: 9
These settings are used by most traders and remain effective across multiple markets.
Beginners are generally advised to use default settings before experimenting with modifications.
Common MACD Mistakes
Trading Every Crossover
Not every crossover produces a profitable trade.
Always consider market context.
Ignoring Trend Direction
A bullish crossover inside a strong downtrend may fail quickly.
Trend analysis should come first.
Using MACD Alone
MACD should support price action, not replace it.
The strongest setups occur when multiple factors align.
Trading Divergence Too Early
Divergence can persist for extended periods before a reversal occurs.
Patience and confirmation remain essential.
Advantages of MACD
Benefits include:
- Easy to understand
- Combines trend and momentum
- Effective in trending markets
- Useful for divergence analysis
- Widely used by traders worldwide
These advantages explain its popularity.
Limitations of MACD
MACD is not perfect.
Lagging Indicator
Because MACD is based on moving averages, signals occur after price movement has already begun.
Weak in Sideways Markets
Range-bound markets often produce unreliable crossover signals.
False Signals
Like all indicators, MACD occasionally generates misleading signals.
Risk management remains essential.
Practical MACD Checklist
Before entering a trade, ask:
✓ Is the market trending?
✓ Is MACD above or below zero?
✓ Is market structure bullish or bearish?
✓ Is there a crossover signal?
✓ Is momentum increasing?
✓ Does price action confirm the setup?
The more factors that align, the stronger the trade idea may become.
How Professional Traders Use MACD
Professional traders often follow this process:
- Identify overall trend.
- Analyze market structure.
- Mark support and resistance.
- Evaluate MACD direction.
- Wait for confirmation.
- Execute with proper risk management.
Notice that MACD is part of the process, not the entire strategy.
Final Thoughts
MACD remains one of the most powerful technical indicators available to Forex traders.
By combining trend analysis and momentum measurement, it provides valuable insight into market conditions.
Remember:
- MACD measures trend and momentum.
- Crossovers are useful but not sufficient alone.
- The histogram reveals momentum changes.
- Divergence can warn of weakening trends.
- Price action should always come first.
When combined with market structure, support and resistance, and sound risk management, MACD can become a valuable component of a complete trading system.
Related Articles
- Moving Averages in Forex Trading
- RSI Indicator in Forex Trading
- How to Identify Market Trends
- Trendlines in Forex Trading
- Bullish vs Bearish Market Structure
- Supply and Demand Zones Explained
FAQ
What does MACD stand for?
MACD stands for Moving Average Convergence Divergence.
What is a bullish MACD crossover?
A bullish crossover occurs when the MACD line crosses above the signal line, suggesting increasing bullish momentum.
Is MACD better than RSI?
Neither indicator is universally better. MACD is stronger for trend analysis, while RSI is useful for identifying momentum extremes.
What is MACD divergence?
MACD divergence occurs when price and the MACD indicator move in different directions, potentially signaling weakening momentum.
What are the best MACD settings?
The standard settings of 12, 26, and 9 remain the most widely used and effective for most traders.


