
If there is one technical indicator that almost every Forex trader has used at some point, it is the Moving Average.
From beginner traders to institutional professionals, moving averages remain one of the most widely used tools in technical analysis.
The reason is simple.
Moving averages help traders identify trends, reduce market noise, and make more informed trading decisions.
While they may appear simple, moving averages can provide valuable insights into market direction and momentum.
In this guide, you’ll learn:
- What moving averages are
- How they work
- The difference between SMA and EMA
- Common moving average strategies
- Advantages and disadvantages
- Common mistakes traders make
What Is a Moving Average?
A moving average is a technical indicator that calculates the average price of an asset over a specific period.
As new price data becomes available, the average continuously updates.
This creates a smooth line on the chart that helps traders identify the underlying trend.
Instead of focusing on every price fluctuation, traders can use moving averages to see the bigger picture.
Why Moving Averages Matter
Financial markets rarely move in straight lines.
Price constantly fluctuates due to:
- News events
- Economic releases
- Market sentiment
- Trader behavior
These fluctuations can make trend identification difficult.
Moving averages help filter out short-term noise and highlight the overall direction of the market.
Benefits include:
- Trend identification
- Dynamic support and resistance
- Trade filtering
- Momentum analysis
- Entry and exit signals
How Moving Averages Work
A moving average takes a selected number of previous price periods and calculates their average value.
For example:
A 20-period moving average calculates the average closing price of the last 20 candles.
As each new candle forms:
- The oldest value is removed.
- The newest value is added.
- The average updates.
This creates a moving line that follows price.
Types of Moving Averages
There are many variations, but the two most common are:
Simple Moving Average (SMA)
The Simple Moving Average gives equal weight to every price within the selected period.
For example:
A 20-period SMA treats all 20 candles equally.
Characteristics:
- Smooth appearance
- Slower reaction to price changes
- Less sensitive to market noise
Many long-term traders prefer SMA because of its stability.
Exponential Moving Average (EMA)
The Exponential Moving Average places greater emphasis on recent prices.
This makes EMA more responsive to current market conditions.
Characteristics:
- Faster reaction to price
- More sensitive to momentum shifts
- Popular among short-term traders
Because EMA responds more quickly, it often generates signals earlier than SMA.
However, it can also produce more false signals.
SMA vs EMA
Both indicators serve similar purposes, but each has strengths and weaknesses.
SMA Advantages
- Smoother trend visualization
- Fewer false signals
- Better for long-term analysis
SMA Disadvantages
- Slower response
- Delayed signals
EMA Advantages
- Faster trend detection
- Better for active traders
- More responsive to market changes
EMA Disadvantages
- More sensitive to noise
- Higher likelihood of false signals
Neither is universally better.
The choice depends on trading style and objectives.
Popular Moving Average Periods
Different traders use different settings.
Some of the most common include:
20 Moving Average
Used for:
- Short-term trend analysis
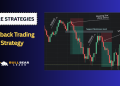
- Pullback trading
- Dynamic support and resistance
50 Moving Average
One of the most popular settings.
Used for:
- Medium-term trend analysis
- Trend confirmation
100 Moving Average
Often used to identify broader market direction.
200 Moving Average
Widely followed by professional traders and institutions.
Used for:
- Long-term trend identification
- Market bias determination
Many traders consider markets bullish when price remains above the 200 MA and bearish when below it.
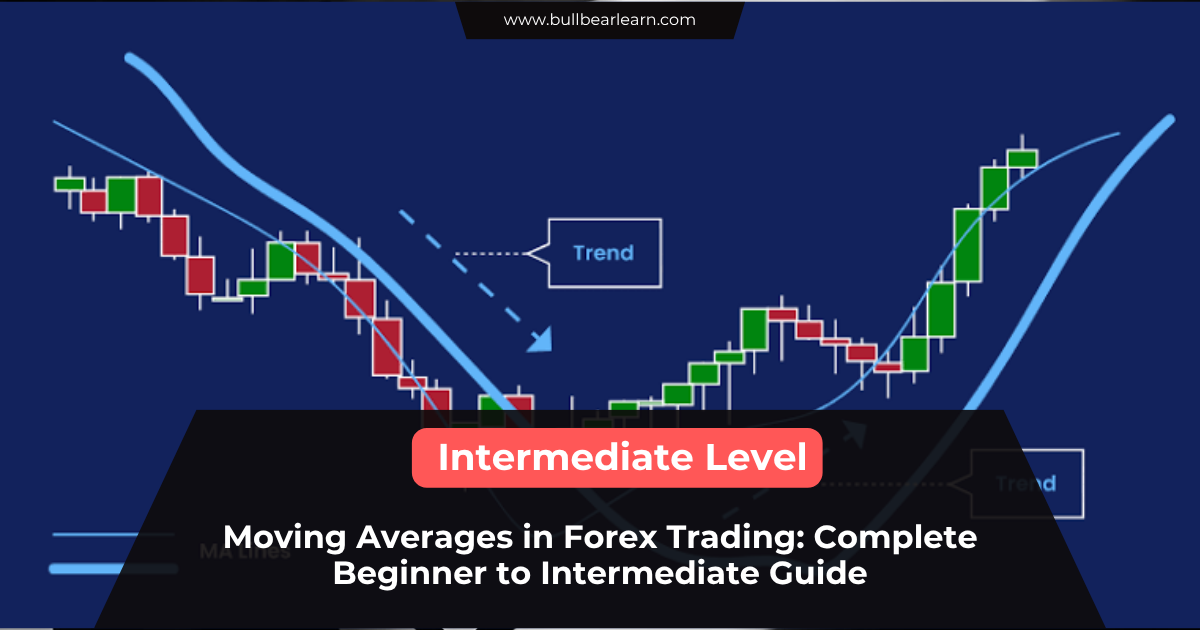
Identifying Trends with Moving Averages
One of the primary uses of moving averages is trend identification.
Bullish Trend
A bullish trend often displays:
- Price above the moving average
- Rising moving average slope
- Consistent higher highs and higher lows
This suggests buyers control the market.
Bearish Trend
A bearish trend often displays:
- Price below the moving average
- Declining moving average slope
- Lower highs and lower lows
This suggests sellers control the market.
Dynamic Support and Resistance
Moving averages can also act as dynamic support and resistance.
Unlike horizontal support and resistance levels, moving averages move with price.
Dynamic Support
In an uptrend:
Price may repeatedly bounce from the moving average.
Traders often view this as a potential buying area.
Dynamic Resistance
In a downtrend:
Price may repeatedly reject the moving average.
This can create selling opportunities.
Moving Average Crossovers
One of the most popular moving average strategies involves crossovers.
A crossover occurs when one moving average crosses another.
Golden Cross
A Golden Cross occurs when:
- Shorter moving average crosses above longer moving average
Example:
- 50 MA crosses above 200 MA
Many traders interpret this as a bullish signal.
Death Cross
A Death Cross occurs when:
- Shorter moving average crosses below longer moving average
Example:
- 50 MA crosses below 200 MA
This is often considered a bearish signal.
Using Moving Averages for Trade Entries
Moving averages should not be used alone.
However, they can help identify potential trade setups.
Buy Setup Example
Conditions:
- Uptrend present
- Price above 50 EMA
- Pullback into EMA
- Bullish candlestick confirmation
This may provide a long opportunity.
Sell Setup Example
Conditions:
- Downtrend present
- Price below 50 EMA
- Pullback into EMA
- Bearish confirmation candle
This may provide a short opportunity.
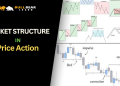
Combining Moving Averages with Price Action
Professional traders rarely rely on moving averages alone.
Instead, they combine them with:
- Support and resistance
- Market structure
- Trendlines
- Supply and demand zones
- Candlestick patterns
This creates stronger trade setups.
For example:
A bullish engulfing candle forming at a demand zone while price respects the 50 EMA often carries more significance than the EMA signal alone.
Common Moving Average Mistakes
Using Too Many Moving Averages
Many beginners add multiple moving averages to the same chart.
This often creates confusion.
A simple setup is usually more effective.
Trading Every Crossover
Not every crossover leads to a profitable trade.
Many occur during ranging markets.
Always consider market context.
Ignoring Market Structure
Moving averages should support price action analysis, not replace it.
Market structure remains more important.
Expecting Perfect Signals
Moving averages are lagging indicators.
They follow price rather than predict it.
No moving average can guarantee future market direction.
Advantages of Moving Averages
Moving averages offer several benefits:
- Easy to understand
- Effective trend filter
- Useful across all timeframes
- Adaptable to different strategies
- Widely respected by market participants
This versatility explains their popularity.
Limitations of Moving Averages
Despite their usefulness, moving averages have limitations.
Lagging Nature
Because they use historical prices, moving averages react after price has already moved.
Poor Performance in Ranges
During sideways markets, moving averages often generate false signals.
Not a Standalone Strategy
Moving averages work best when combined with other forms of analysis.
Practical Moving Average Checklist
Before using a moving average setup, ask:
✓ Is the market trending?
✓ Is price above or below the moving average?
✓ Does market structure support the trade?
✓ Is there nearby support or resistance?
✓ Does price action provide confirmation?
✓ Is risk-to-reward favorable?
The more factors that align, the stronger the setup may become.
Final Thoughts
Moving averages remain one of the most valuable tools in Forex trading.
They help traders identify trends, filter market noise, and improve decision-making.
Remember:
- SMA is smoother and slower.
- EMA is faster and more responsive.
- Moving averages work best in trending markets.
- Price action should always come first.
- Moving averages are most effective when combined with other technical tools.
Mastering moving averages provides a strong foundation for more advanced indicators such as RSI, MACD, and trend-following trading systems.
Related Articles
- How to Identify Market Trends
- Trendlines in Forex Trading
- Support and Resistance Explained
- Supply and Demand Zones Explained
- Multi Timeframe Analysis Guide
- RSI Indicator Guide
FAQ
What is the best moving average for Forex trading?
There is no single best moving average. The 20, 50, and 200-period moving averages are among the most commonly used.
Is EMA better than SMA?
EMA reacts faster to price changes, while SMA provides smoother signals. The best choice depends on your trading style.
Do professional traders use moving averages?
Yes. Many professional traders use moving averages as part of broader trading systems.
Can moving averages predict the market?
No. Moving averages are lagging indicators that help identify trends but cannot predict future prices.
Which moving average is best for beginners?
Many beginners start with the 50 EMA and 200 SMA because they are widely used and easy to interpret.


