
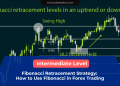
Fibonacci Retracement is one of the most popular tools in technical analysis.
Many traders use Fibonacci levels to identify:
- Potential pullback zones
- Support and resistance areas
- Trade entry opportunities
- Profit targets
At first glance, Fibonacci may seem complicated because it involves mathematical ratios and percentages.
However, most traders do not need to understand the underlying mathematics in detail.
What matters is knowing how to use Fibonacci levels effectively within a trading strategy.
In this guide, you’ll learn:
- What Fibonacci Retracement is
- Why traders use it
- How to draw Fibonacci correctly
- Key Fibonacci levels
- Common trading strategies
- Mistakes to avoid
By the end of this article, you’ll understand how Fibonacci can help improve trade timing and identify high-probability setups.
What Is Fibonacci Retracement?
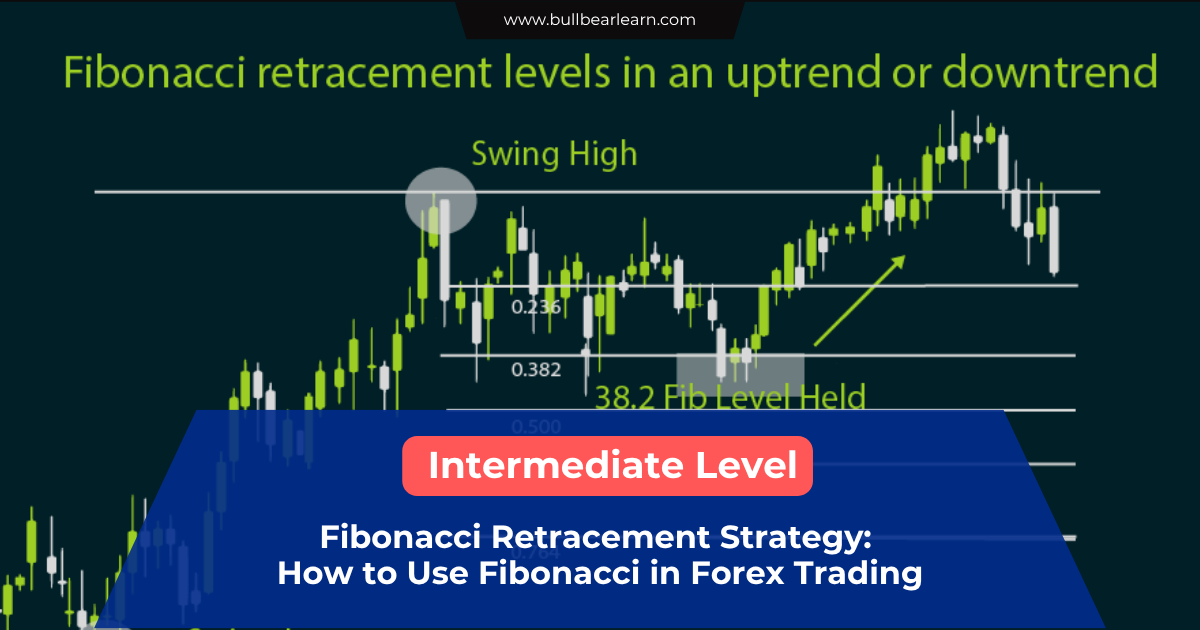
Fibonacci Retracement is a technical analysis tool used to identify potential pullback areas within a trend.
The tool is based on the Fibonacci sequence, a mathematical pattern discovered by the Italian mathematician Leonardo Fibonacci.
In trading, Fibonacci Retracement projects percentage-based levels between a significant swing high and swing low.
These levels may act as:
- Support during uptrends
- Resistance during downtrends
Many traders use them to anticipate where price could retrace before continuing in the original trend direction.
Why Fibonacci Retracement Works
Financial markets rarely move in straight lines.
Even strong trends experience temporary pullbacks.
The challenge is determining where those pullbacks might end.
Fibonacci levels provide potential areas where buyers or sellers may re-enter the market.
Importantly:
Fibonacci levels do not predict the future.
Instead, they highlight zones where market reactions may occur.
When combined with other technical tools, they can become powerful areas of confluence.
Key Fibonacci Retracement Levels
Most trading platforms automatically display the main Fibonacci levels.
The most important are:
23.6%
A shallow retracement.
Often seen during very strong trends.
Price may resume the trend quickly without a deep pullback.
38.2%
A moderate retracement level.
Common in healthy trending markets.
Many traders monitor this area for continuation opportunities.
50%
Although technically not a Fibonacci ratio, the 50% level is widely used by traders.
Markets frequently retrace roughly half of a previous move before continuing.
61.8%
The most important Fibonacci level.
Known as the “Golden Ratio.”
\phi=\frac{1+\sqrt5}{2}\approx1.618
The inverse of the Golden Ratio creates the famous 61.8% retracement level.
Many professional traders pay close attention to this zone.
78.6%
A deep retracement level.
Price reaching this area may still continue the trend, but the probability of trend failure increases.
How to Draw Fibonacci Retracement Correctly
One of the biggest challenges for beginners is drawing Fibonacci properly.
The process is simple once you understand market structure.
Drawing Fibonacci in an Uptrend
Step 1:
Identify a significant swing low.
Step 2:
Identify the subsequent swing high.
Step 3:
Draw Fibonacci from:
- Swing Low → Swing High
The retracement levels now represent potential support zones.
Drawing Fibonacci in a Downtrend
Step 1:
Identify a significant swing high.
Step 2:
Identify the subsequent swing low.
Step 3:
Draw Fibonacci from:
- Swing High → Swing Low
The retracement levels now represent potential resistance zones.
Using Fibonacci in Trending Markets
Fibonacci works best in trending environments.
Bullish Example
Suppose EUR/USD is making:
- Higher highs
- Higher lows
The market is clearly bullish.
After a strong rally, price begins retracing.
As price approaches:
- 38.2%
- 50%
- 61.8%
Traders watch for bullish reactions.
If buyers return, the uptrend may continue.
Bearish Example
Suppose GBP/USD is making:
- Lower highs
- Lower lows
The market is bearish.
After a decline, price rallies temporarily.
As price approaches key Fibonacci levels, traders monitor for bearish confirmation.
If sellers regain control, the downtrend may resume.
Fibonacci and Support and Resistance
One of the most effective uses of Fibonacci is combining it with support and resistance.
For example:
A 61.8% retracement that aligns with:
- Previous resistance
- Trendline support
- Demand zone
is often more significant than a Fibonacci level alone.
This concept is known as confluence.
Professional traders constantly seek confluence before entering trades.
Fibonacci and Market Structure
Market structure remains more important than any indicator.
Before using Fibonacci, ask:
- Is the trend bullish?
- Is the trend bearish?
- Is the market ranging?
Fibonacci performs best when market structure clearly supports the trend.
Using Fibonacci during random sideways movement often produces unreliable results.
Fibonacci and Candlestick Confirmation
Many traders wait for price action confirmation at Fibonacci levels.
Useful bullish signals include:
- Bullish engulfing candle
- Hammer
- Strong rejection wick
Useful bearish signals include:
- Bearish engulfing candle
- Shooting star
- Bearish rejection candle
Candlestick confirmation can improve trade quality significantly.
Fibonacci Pullback Strategy
One of the most common Fibonacci strategies involves trading pullbacks.
Bullish Setup
Requirements:
- Uptrend
- Fibonacci retracement drawn correctly
- Price reaches 50% or 61.8%
- Bullish confirmation candle
Potential plan:
- Buy near retracement zone
- Stop loss below swing low
- Target previous high
Bearish Setup
Requirements:
- Downtrend
- Fibonacci retracement drawn correctly
- Price reaches 50% or 61.8%
- Bearish confirmation candle
Potential plan:
- Sell near retracement zone
- Stop loss above swing high
- Target previous low
This approach aligns with trend-following principles.
Fibonacci Extension Levels
While retracements identify pullbacks, extensions help estimate profit targets.
Popular extension levels include:
- 127.2%
- 161.8%
- 261.8%
Traders often use these levels to identify potential take-profit zones after trend continuation.
Common Beginner Mistakes
Drawing Fibonacci on Small Swings
Not every price movement deserves Fibonacci analysis.
Focus on meaningful swing highs and swing lows.
Ignoring Trend Direction
Fibonacci works best when aligned with market structure.
Always identify the trend first.
Treating Levels as Exact Prices
Fibonacci levels are zones rather than precise numbers.
Price may react slightly above or below a level.
Trading Fibonacci Alone
Many traders make the mistake of entering trades solely because price reaches 61.8%.
Professional traders seek additional confirmation.
Using Too Many Fibonacci Drawings
Charts filled with multiple Fibonacci tools often become confusing.
Keep analysis simple.
Advantages of Fibonacci Retracement
Benefits include:
- Easy to use
- Works on all timeframes
- Helps identify pullback opportunities
- Improves trade timing
- Pairs well with price action
These advantages explain its popularity among traders worldwide.
Limitations of Fibonacci Retracement
Despite its usefulness, Fibonacci has limitations.
Subjective Swing Selection
Different traders may choose different swing highs and lows.
This can produce different levels.
No Guaranteed Reactions
Price does not always respect Fibonacci levels.
Risk management remains essential.
Less Effective in Ranging Markets
Fibonacci generally performs best during trending conditions.
Practical Fibonacci Checklist
Before using Fibonacci, ask:
✓ Is the market trending?
✓ Have I identified a significant swing?
✓ Does market structure support the trade?
✓ Is there nearby support or resistance?
✓ Is there candlestick confirmation?
✓ Is risk-to-reward favorable?
The more factors that align, the stronger the setup may become.
How Professional Traders Use Fibonacci
Professional traders rarely rely on Fibonacci alone.
Instead, they combine:
- Market structure
- Trend analysis
- Support and resistance
- Supply and demand
- Price action
- Risk management
Fibonacci becomes one piece of a larger decision-making process.
The strongest setups usually occur when several technical factors point to the same conclusion.
Final Thoughts
Fibonacci Retracement is one of the most widely used tools in Forex trading.
When applied correctly, it can help traders identify pullback opportunities and improve entry timing.
Remember:
- Fibonacci works best in trending markets.
- The 61.8% level is particularly important.
- Confluence improves reliability.
- Market structure should come first.
- Risk management remains essential.
Used alongside price action and trend analysis, Fibonacci can become a valuable addition to your trading toolkit.
Related Articles
- Moving Averages in Forex Trading
- RSI Indicator in Forex Trading
- MACD Indicator Explained
- How to Identify Market Trends
- Support and Resistance Explained
- Supply and Demand Zones Explained
- Multi Timeframe Analysis Guide
FAQ
What is Fibonacci Retracement in Forex?
Fibonacci Retracement is a technical analysis tool used to identify potential pullback areas within a trend.
What is the most important Fibonacci level?
The 61.8% level is generally considered the most significant Fibonacci retracement level.
Does Fibonacci work in Forex trading?
Many traders use Fibonacci successfully, especially when combined with trend analysis and price action confirmation.
Should I trade every Fibonacci level?
No. Fibonacci levels work best when supported by additional technical factors.
Can Fibonacci predict market direction?
No. Fibonacci identifies potential reaction zones but cannot predict future price movements with certainty.


