
Support and resistance are among the most misunderstood concepts in trading.
Most traders draw too many lines, expect perfect reactions, and become frustrated when price “breaks” a level. The problem is not support and resistance—it is how traders think about them.
This article explains:
-
What support and resistance truly represent
-
How levels form from market behavior
-
Why price reacts near levels
-
Why levels are zones, not lines
Understanding levels correctly is essential before any execution logic makes sense.
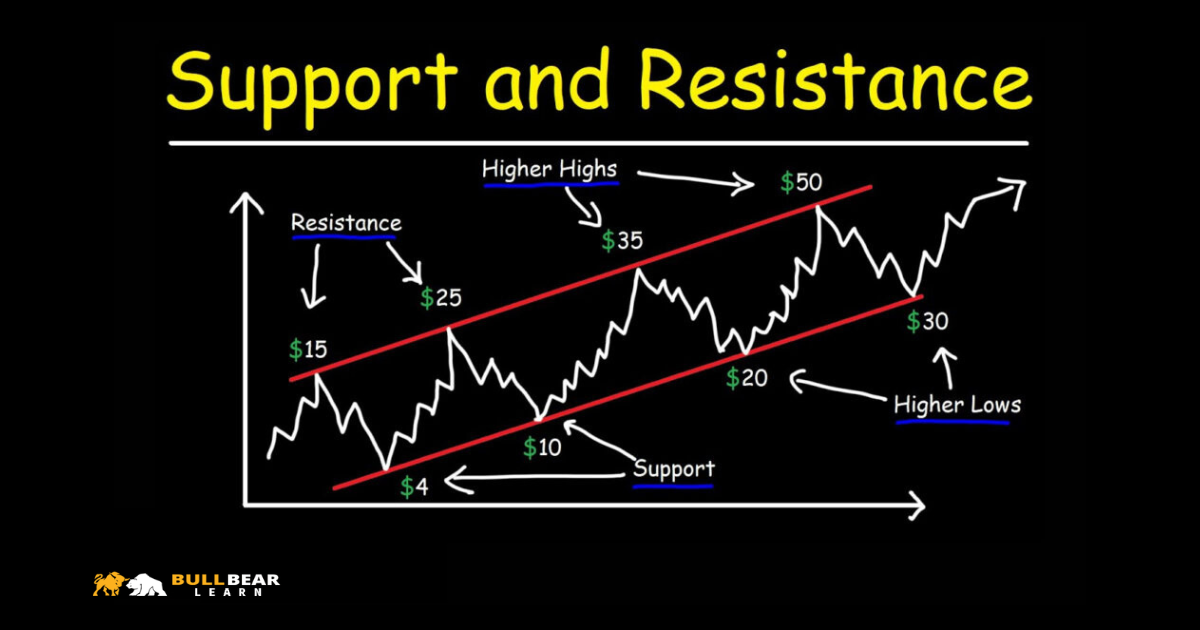
What Are Support and Resistance?
At a basic level:
-
Support is an area where buying pressure has previously outweighed selling
-
Resistance is an area where selling pressure has previously outweighed buying
However, support and resistance are not technical tools. They are visual expressions of supply, demand, and trader psychology.
Price reacts at these areas because market participants remember them.
→ How the Market Moves: Supply, Demand & Psychology
Why Support and Resistance Exist
Levels exist due to collective memory.
Traders remember:
-
Where price reversed sharply
-
Where losses occurred
-
Where profits were missed
-
Where large moves began
When price returns to these areas:
-
Emotions resurface
-
Orders cluster
-
Reactions occur
Support and resistance work because people react similarly in similar situations.
Levels Are Zones, Not Lines
One of the biggest beginner mistakes is drawing razor-thin lines.
In reality:
-
Orders are distributed, not precise
-
Institutions do not enter with single prices
-
Liquidity exists across ranges
This is why price often:
-
Overshoots a level
-
Spikes through it
-
Reacts slightly above or below
Professional traders think in zones, not exact prices.
How Support and Resistance Form
Levels form through repeated interaction.
Common formation types:
-
Strong rejection from a price area
-
Consolidation before a large move
-
Previous highs and lows
-
Areas where structure changed
The more meaningful the reaction, the more relevant the level becomes.
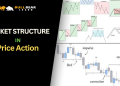
→ Market Structure in Price Action
Support and Resistance Within Trends
Levels behave differently depending on context.
1. In an uptrend:
-
Old resistance often becomes new support
-
Pullbacks stall near higher lows
-
Buyers defend structure
2. In a downtrend:
-
Old support often becomes new resistance
-
Pullbacks fail near lower highs
-
Sellers remain in control
This role reversal is one of the most powerful Price Action concepts.
Why Levels Sometimes Fail
Support and resistance are not barriers—they are areas of interest.
Levels fail when:
-
Order flow overwhelms them
-
Trend momentum is strong
-
Liquidity is consumed
-
Context changes
A broken level does not mean the concept failed—it means market conditions shifted.
Support and Resistance vs Market Structure
Support and resistance do not exist independently.
Structure defines:
-
Which levels matter
-
Which reactions are meaningful
-
Which breaks are significant
A level against strong structure has lower probability than a level aligned with structure.
Context always comes first.
Common Mistakes With Support and Resistance
Avoid these errors:
-
Drawing levels everywhere
-
Expecting exact reversals
-
Ignoring timeframe hierarchy
-
Trading levels without context
-
Treating breaks as failures
Less is more when marking levels.
Higher Timeframe vs Lower Timeframe Levels
Not all levels carry equal weight.
1. Higher timeframe levels:
-
Reflect institutional interest
-
Hold more liquidity
-
Create stronger reactions
2. Lower timeframe levels:
-
Are more fragile
-
Break more easily
-
Useful mainly for refinement
Price Action traders prioritize higher timeframe levels first.
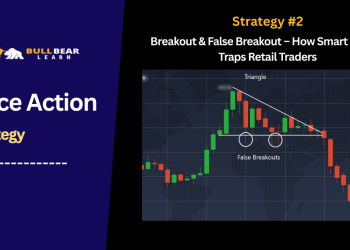
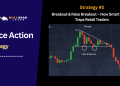
False Breaks and Stop Hunts
Price often moves beyond a level before reversing.
This happens because:
-
Stops cluster near obvious levels
-
Liquidity is needed for large orders
-
Emotional traders react prematurely
False breaks are not manipulation—they are liquidity events.
Understanding this prevents emotional reactions.
Why Support and Resistance Are Not Entry Signals
Levels do not tell you:
-
When to enter
-
Where to place stops
-
How much to risk
They tell you:
-
Where reactions are likely
-
Where decisions occur
-
Where context changes
Execution comes later. Levels provide location, not action.
How Support and Resistance Fit Into the Price Action Framework
Support and resistance connect:
-
Market structure
-
Trends
-
Supply and demand
-
Risk management (later)
Without understanding levels:
-
Entries feel random
-
Stops feel arbitrary
-
Losses feel unfair
With level awareness, traders gain patience and clarity.
How to Practice Identifying Levels
To train your eye:
-
Start on higher timeframes
-
Mark only obvious reaction areas
-
Use zones, not lines
-
Limit the number of levels
-
Observe price behavior near them
The goal is recognition, not perfection.
Final Thoughts
Support and resistance are not magic lines on a chart.
They are psychological battlegrounds where buyers and sellers make decisions. When you understand how levels form and why reactions occur, price behavior becomes more logical and less emotional.
In the next article, we will transition from foundation to application by introducing Price Action Execution Concepts, explaining how traders combine structure, trends, and levels to make decisions—without turning Price Action into rigid rules.


