
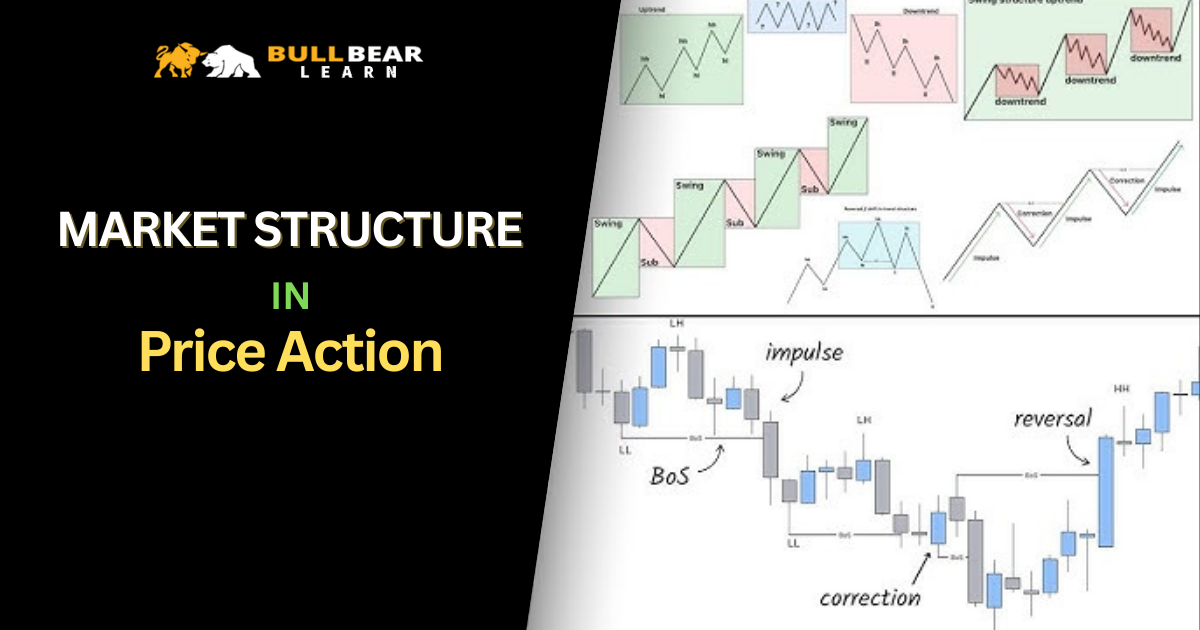
Market structure is the backbone of Price Action trading.
If you do not understand market structure, every candlestick pattern, support and resistance level, or breakout will feel unreliable. With structure, price behavior becomes logical, repeatable, and contextual.
This article explains:
-
What market structure is
-
How trends and ranges are formed
-
Why structure matters more than patterns
-
How professional traders read structure objectively
Before thinking about entries or strategies, you must learn to read the market’s framework.
What Is Market Structure?
Market structure describes how price organizes itself over time through swings.
At its simplest level, structure answers one question:
Is the market moving up, moving down, or moving sideways?
Price forms structure by creating:
-
Swing highs
-
Swing lows
These swings reveal who is in control: buyers or sellers.
Market structure is not subjective when defined correctly. It is a sequence, not a pattern.
→ How the Market Moves: Supply, Demand & Psychology
The Three Types of Market Structure
All markets exist in one of three structural states:
1. Uptrend (Bullish Structure)
-
Higher highs (HH)
-
Higher lows (HL)
Buyers are consistently willing to pay higher prices, and sellers fail to push price below previous lows.
2. Downtrend (Bearish Structure)
-
Lower highs (LH)
-
Lower lows (LL)
Sellers dominate, and buyers cannot hold price above previous highs.
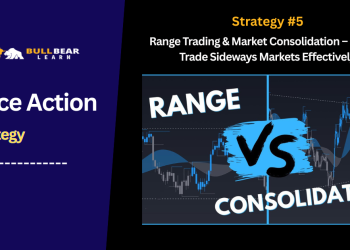
3. Range (Consolidation)
-
Equal highs
-
Equal lows
Neither side has control. Price oscillates within boundaries.
Every Price Action decision must begin with identifying which structure you are in.
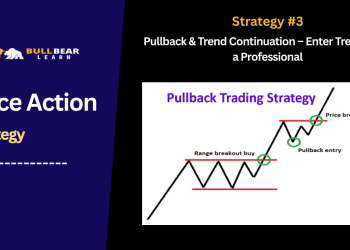
Higher Highs and Higher Lows Explained
In an uptrend, price does not move in a straight line. It advances in waves.
A bullish structure forms when:
-
Price creates a high
-
Pulls back
-
Holds above the previous low
-
Breaks the previous high
This sequence confirms that demand remains strong.
The key insight:
The higher low is more important than the higher high.
As long as higher lows are respected, buyers maintain control—even during pullbacks.
Lower Highs and Lower Lows Explained
In a downtrend, the opposite behavior appears.
A bearish structure forms when:
-
Price drops to a low
-
Pulls back
-
Fails below the previous high
-
Breaks the previous low
Here, supply overwhelms demand.
Again, the lower high is critical. It shows sellers defending territory and rejecting higher prices.
Why Structure Is More Important Than Candlestick Patterns
Many beginners focus on individual candles:
-
Pin bars
-
Engulfing patterns
-
Inside bars
Without structure, these patterns are meaningless.
The same candle can be:
-
A continuation signal in a trend
-
A failure signal in a range
-
Noise in low-liquidity conditions
Professional traders ask:
“Where is this candle forming within the structure?”
Structure provides context, patterns provide detail.
Market Structure Is Fractal
Market structure exists on all timeframes:
-
Daily
-
H4
-
H1
-
M15
However, not all structures carry equal weight.
Higher timeframes:
-
Define dominant bias
-
Control major supply and demand
-
Override lower timeframe noise
Lower timeframes:
-
Reflect execution
-
Show internal fluctuations
This is why top-down analysis is essential in Price Action trading.
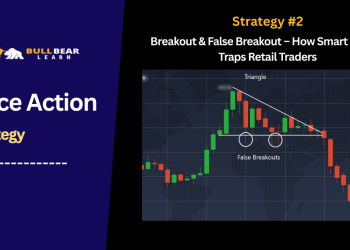
Break of Structure vs Change of Character
Two important structural concepts:
Break of Structure (BOS)
Occurs when price breaks a key swing high or low in the direction of the trend.
BOS confirms continuation.
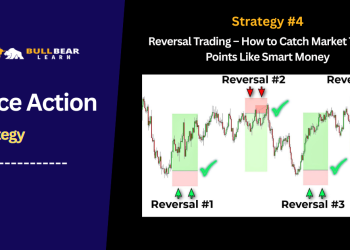
Change of Character (CHOCH)
Occurs when price breaks a key level against the prevailing structure.
CHOCH signals a potential shift in control—but not an immediate reversal.
These concepts help traders avoid reacting emotionally to every pullback.
Why Most Traders Misidentify Structure
Common mistakes include:
-
Marking every minor swing
-
Ignoring higher timeframe context
-
Confusing pullbacks with reversals
-
Drawing structure after the fact
Correct structure analysis focuses on:
-
Meaningful swings
-
Clear reactions
-
Context, not precision
Structure is about behavior, not perfect symmetry.
Structure and Market Phases
Market structure evolves through phases:
-
Expansion (impulse)
-
Retracement (correction)
-
Consolidation
Trends are built from impulse + correction cycles.
When impulse weakens and corrections deepen, structure begins to degrade—often before reversals occur.
This gradual transition is visible only through structural analysis.
Ranges Are Not Random
Ranges form when:
-
Buyers and sellers reach temporary balance
-
Large orders are absorbed
-
Institutions accumulate or distribute
Within ranges:
-
Breakouts often fail
-
False moves are common
-
Patience is rewarded
Understanding range structure helps traders avoid forcing trades in unfavorable conditions.
Why Structure Keeps Traders Aligned With the Market
Market structure prevents:
-
Trading against momentum
-
Overtrading during consolidation
-
Emotional decision-making
Instead of asking:
“Is this a signal?”
Structure-based traders ask:
“Is this move consistent with the current structure?”
This shift dramatically improves consistency.
How Market Structure Fits Into the Price Action Framework
Market structure connects:
-
Supply and demand
-
Trends
-
Support and resistance
-
Entries and exits (later)
Without structure:
-
Levels feel unreliable
-
Trends feel unclear
-
Trades feel random
With structure:
-
Everything has context
This is why structure is taught before execution.
How to Practice Reading Market Structure
To develop skill:
-
Remove indicators
-
Mark only clear swing highs and lows
-
Start with higher timeframes
-
Describe structure in words, not lines
-
Review charts historically
The goal is not speed—it is clarity.
Final Thoughts
Market structure is the language of the market.
Once you understand how price builds higher highs, lower lows, and ranges, Price Action stops feeling mysterious.
This foundation allows you to:
-
Stay aligned with dominant forces
-
Avoid low-probability trades
-
Build strategies on solid ground
In the next article, we will dive into trends in Price Action, explaining how trends develop, mature, and end—and how traders stay on the right side of them.
→ Trends in Price Action Trading


