
Forex Beginner Course – Lesson 14 of 20
If you open a trading platform for the first time, the chart may look overwhelming. Prices move constantly, candles change shape every second, and multiple timeframes appear to tell different stories.
Yet every trading decision begins with one essential skill: reading a Forex chart correctly.
Before learning advanced strategies, indicators, or price action techniques, traders must understand how charts represent market activity. A chart is more than a collection of lines and candles—it is a visual record of the ongoing battle between buyers and sellers.
This guide explains the fundamentals of Forex charts, including chart types, candlestick analysis, timeframes, and basic market structure concepts that every beginner should master.
Why Learning to Read Forex Charts Matters
Charts are the primary source of information for most traders.
Whether you use technical analysis, price action, or even fundamental analysis, charts help answer important questions:
- Is the market trending or ranging?
- Who currently controls the market?
- Where are important support and resistance levels?
- Is momentum increasing or weakening?
- Where might potential trading opportunities appear?
Without understanding charts, it becomes difficult to make informed trading decisions.
What Does a Forex Chart Show?
A Forex chart displays how the exchange rate between two currencies changes over time.
For example:
EUR/USD = 1.1200
This means one euro can be exchanged for 1.1200 U.S. dollars.
As buyers and sellers interact in the market, the exchange rate changes, creating the movements displayed on a chart.
Every chart contains two essential elements:
Price
Displayed on the vertical axis.
Time
Displayed on the horizontal axis.
Together, these elements create a visual representation of market activity.
The Main Types of Forex Charts
Most trading platforms offer three chart types.
Line Chart
A line chart connects closing prices together.
Advantages:
- Simple
- Easy to read
- Useful for identifying broad trends
Disadvantages:
- Limited information
- Does not show intraday price movement
Because of these limitations, line charts are rarely used for active trading.
Bar Chart
Bar charts provide more information than line charts.
Each bar displays:
- Open price
- High price
- Low price
- Close price
This format gives traders additional insight into market behavior.
However, many beginners find bar charts harder to interpret.
Candlestick Chart
Candlestick charts are the most popular chart type among Forex traders.
They display:
- Open
- High
- Low
- Close
while presenting the information in a highly visual format.
Most traders use candlestick charts because they reveal market sentiment more clearly.
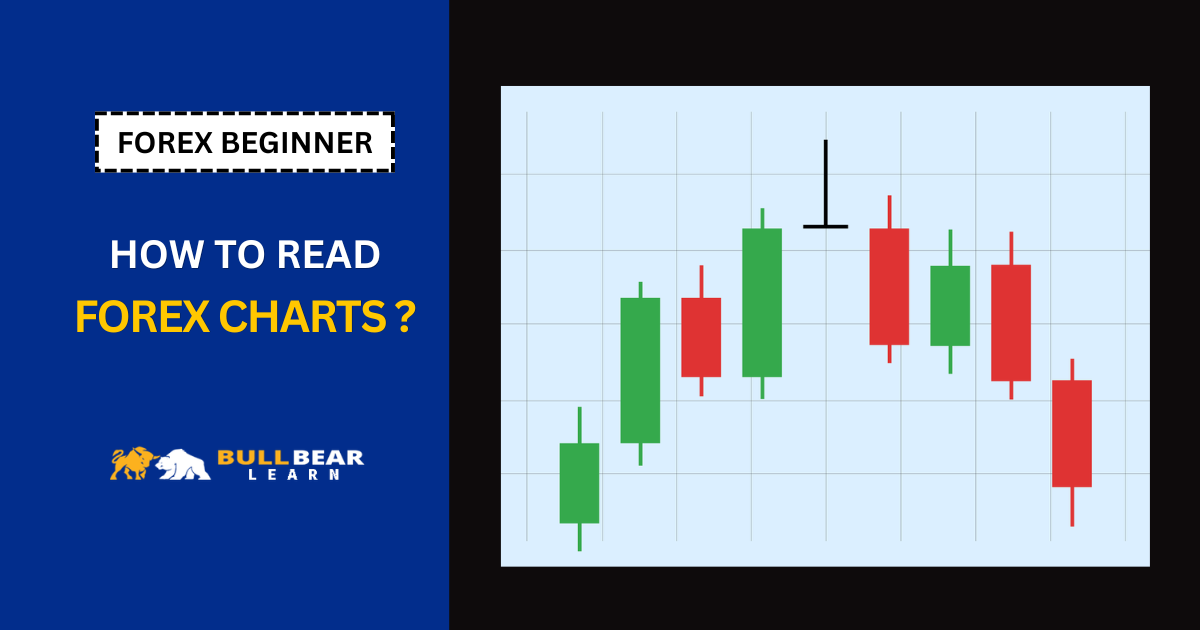
Understanding Candlesticks
A candlestick represents price movement during a specific period.
Each candle consists of:
Body
The distance between the opening and closing price.
Upper Wick
The highest price reached during the period.
Lower Wick
The lowest price reached during the period.
Bullish Candlestick
The closing price is higher than the opening price.
This suggests buyers were stronger during that period.
Bearish Candlestick
The closing price is lower than the opening price.
This suggests sellers controlled the market.
What Candlesticks Reveal About Market Psychology
Candlesticks are valuable because they show the balance of power between buyers and sellers.
Consider a large bullish candle.
It often indicates:
- Strong buying pressure
- Market confidence
- Momentum continuation
Conversely, a large bearish candle often signals:
- Strong selling pressure
- Fear or uncertainty
- Increased downside momentum
This is why many traders study candlestick behavior as part of their market analysis.
Common Candlestick Patterns
Doji
A Doji forms when the opening and closing prices are nearly identical.
It often suggests indecision.
Hammer
A hammer has a small body and a long lower wick.
It may indicate buyers are beginning to regain control.
Shooting Star
A shooting star has a small body and a long upper wick.
It may signal weakening bullish momentum.
Engulfing Pattern
An engulfing pattern occurs when one candle completely covers the previous candle’s body.
Many traders view engulfing patterns as strong momentum signals.
However, candlestick patterns should never be analyzed in isolation.
Context is critical.
Understanding Timeframes
A timeframe determines how much time each candle represents.
Common timeframes include:
- 1 Minute (M1)
- 5 Minutes (M5)
- 15 Minutes (M15)
- 1 Hour (H1)
- 4 Hours (H4)
- Daily (D1)
- Weekly (W1)
Each timeframe provides a different perspective on the market.
Which Timeframe Should Beginners Use?
One of the biggest mistakes new traders make is focusing exclusively on very short-term charts.
For beginners:
Recommended
- H1
- H4
- Daily
These timeframes:
- Reduce market noise
- Provide clearer trends
- Encourage patience
Less Recommended
- M1
- M5
Short-term charts often create excessive stress and false signals.
Multi-Timeframe Analysis
Professional traders rarely rely on a single timeframe.
Instead, they analyze multiple timeframes simultaneously.
Example:
Daily Chart
Determine overall trend.
H4 Chart
Identify key support and resistance levels.
H1 Chart
Look for potential entries.
This process helps traders align short-term decisions with broader market conditions.
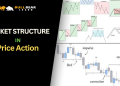
Understanding Market Structure
Market structure refers to the way price moves over time.
It helps traders identify trends and market direction.
Uptrend
An uptrend forms when price creates:
- Higher highs
- Higher lows
This indicates buyers are in control.
Downtrend
A downtrend forms when price creates:
- Lower highs
- Lower lows
This indicates sellers dominate the market.
Range
A range occurs when price moves sideways between support and resistance.
Neither buyers nor sellers have clear control.
Understanding market structure is one of the most important chart-reading skills.
Support and Resistance
Support and resistance are key areas where price often reacts.
Support
A level where buying pressure may emerge.
Resistance
A level where selling pressure may emerge.
These levels often become decision points for traders.
Rather than focusing on exact prices, think of support and resistance as zones.
Common Chart Reading Mistakes
Looking for Perfect Patterns
Markets rarely produce textbook examples.
Focus on understanding concepts rather than memorizing shapes.
Ignoring Higher Timeframes
A strong trend on the daily chart often outweighs signals on lower timeframes.
Zooming In Too Much
Many beginners become trapped by short-term fluctuations.
Always consider the broader market context.
Overcomplicating Analysis
Simple chart analysis is often more effective than cluttered charts filled with indicators.
How to Practice Reading Forex Charts
The best way to improve chart-reading skills is through repetition.
A simple practice routine:
- Open a daily chart.
- Identify the trend.
- Mark support and resistance zones.
- Observe candlestick behavior.
- Record observations in a trading journal.
Over time, patterns become easier to recognize.
Building the Foundation for Price Action Trading
Learning to read charts correctly prepares traders for more advanced concepts.
Once you can identify:
- Trends
- Support and resistance
- Market structure
- Candlestick behavior
you are ready to begin studying price action trading.
Price action builds upon the chart-reading skills covered in this lesson.
Conclusion
Reading Forex charts is one of the most important skills a trader can develop. Understanding candlesticks, timeframes, and market structure provides the foundation for technical analysis and informed decision-making.
While indicators can be useful, traders who understand raw price movement often gain a deeper understanding of market behavior.
Mastering chart reading takes practice, but it is one of the most valuable investments a beginner can make in their trading education.
Previous Lesson
Next Lesson
- Introduction to Price Action Trading for Beginners


