
If you ask ten successful Forex traders about their favorite indicators, you will probably get ten different answers. Some prefer moving averages, others rely on RSI, while many use a combination of tools to analyze market conditions.
For beginners, indicators can be extremely helpful. They simplify price data and provide additional context about trends, momentum, and potential trading opportunities. However, indicators are often misunderstood. Many new traders believe that indicators can predict the market or generate guaranteed buy and sell signals. In reality, indicators are simply tools that help traders make more informed decisions.
This guide explains the most popular Forex indicators for beginners, how they work, their strengths and weaknesses, and how to avoid common mistakes when using them.
What Are Forex Indicators?
A Forex indicator is a mathematical calculation based on historical price data. Indicators help traders analyze:
- Market trends
- Momentum
- Volatility
- Support and resistance
- Potential entry and exit points
Indicators do not predict the future. Instead, they help traders interpret market behavior more objectively.
Most trading platforms, including MT4 and MT5, provide dozens of built-in indicators that can be added to charts with just a few clicks.
Why Beginners Use Indicators
Indicators can help simplify the learning process by providing visual information that may not be immediately obvious from raw price action.
Benefits include:
- Identifying trends
- Measuring momentum
- Highlighting potential reversals
- Improving trade timing
- Creating structured trading rules
However, indicators should support decision-making rather than replace critical thinking.
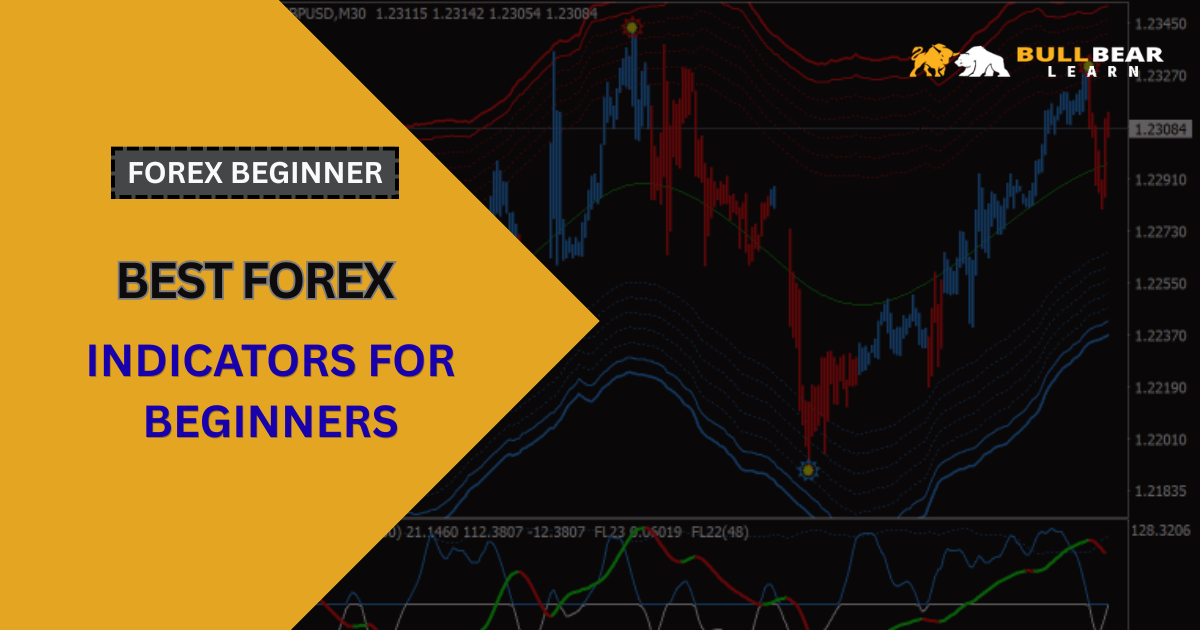
Indicator Category #1: Trend Indicators
Trend indicators help traders determine the overall direction of the market.
Moving Average (MA)
The Moving Average is one of the most widely used indicators in Forex trading.
It calculates the average price over a specific period and smooths out short-term fluctuations.
Common settings:
- 20-period MA
- 50-period MA
- 100-period MA
- 200-period MA
How Traders Use Moving Averages
Bullish conditions:
- Price above MA
- MA sloping upward
Bearish conditions:
- Price below MA
- MA sloping downward
Many traders use the 200-day moving average to identify long-term trends.
Advantages
- Easy to understand
- Effective in trending markets
- Helps filter market noise
Disadvantages
- Lagging indicator
- Can generate false signals in ranging markets
Indicator Category #2: Momentum Indicators
Momentum indicators measure the speed and strength of price movements.
Relative Strength Index (RSI)
The RSI is one of the most popular momentum indicators.
It ranges from 0 to 100.
Traditional interpretation:
- Above 70 = Overbought
- Below 30 = Oversold
Example
If EUR/USD rises rapidly, RSI may move above 70, indicating strong bullish momentum.
However, overbought does not necessarily mean the market will immediately reverse.
Advantages
- Easy to interpret
- Useful for identifying momentum shifts
- Works well with trend analysis
Disadvantages
- Can remain overbought or oversold for extended periods
- Generates false reversal signals during strong trends
Indicator Category #3: Trend + Momentum Indicators
MACD (Moving Average Convergence Divergence)
MACD combines trend-following and momentum analysis.
Components include:
- MACD Line
- Signal Line
- Histogram
Traders often watch for:
- Bullish crossovers
- Bearish crossovers
- Divergence
Advantages
- Versatile
- Suitable for multiple timeframes
- Helps identify trend strength
Disadvantages
- Lagging nature
- Can become confusing for beginners
Indicator Category #4: Volatility Indicators
Bollinger Bands
Bollinger Bands measure market volatility.
They consist of:
- Middle Moving Average
- Upper Band
- Lower Band
When volatility increases, the bands expand.
When volatility decreases, the bands contract.
Common Uses
- Identifying volatility expansion
- Spotting consolidation phases
- Supporting breakout analysis
Advantages
- Excellent visual representation
- Useful in different market conditions
Disadvantages
- Does not indicate direction by itself
Indicator Category #5: Volume-Based Indicators
While Forex does not provide centralized volume data, many traders use tick volume indicators.
Examples include:
- On Balance Volume (OBV)
- Volume indicators available on MT4 and MT5
These tools attempt to estimate market participation and interest.
For beginners, volume analysis is generally less important than mastering trend and momentum indicators first.
The Best Indicator Combination for Beginners
A common mistake is using too many indicators simultaneously.
Instead, focus on a simple combination.
Example:
Trend
200 Moving Average
Momentum
RSI (14)
Confirmation
Price Action
This approach provides:
- Trend direction
- Momentum confirmation
- Clear chart structure
Without overwhelming the trader.
Common Indicator Mistakes
Using Too Many Indicators
More indicators do not guarantee better results.
Many beginners fill charts with:
- RSI
- MACD
- Stochastic
- Bollinger Bands
- Multiple Moving Averages
This often creates conflicting signals and confusion.
Looking for Perfect Signals
No indicator is accurate 100% of the time.
Indicators should improve probabilities, not eliminate uncertainty.
Ignoring Market Context
Indicators work best when combined with:
- Trend analysis
- Support and resistance
- Risk management
Using indicators without context often leads to poor decisions.
Constantly Changing Settings
Many traders continuously adjust indicator settings after losses.
This prevents meaningful evaluation and usually creates inconsistency.
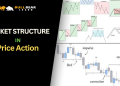
Indicators vs Price Action
One of the biggest debates in Forex trading is whether traders should rely on indicators or price action.
The truth is that both can be useful.
Price action helps traders understand market structure.
Indicators help quantify trends and momentum.
The most effective traders often combine both approaches rather than choosing one exclusively.
How Beginners Should Start
A simple learning process:
- Master Moving Averages
- Learn RSI
- Understand support and resistance
- Practice on a demo account
- Keep a trading journal
Avoid jumping between dozens of indicators.
Consistency is more valuable than complexity.
Conclusion
Forex indicators are powerful tools when used correctly. They help traders identify trends, measure momentum, and understand market conditions more objectively.
For beginners, the best approach is to focus on a small number of indicators and learn them thoroughly. Moving Averages, RSI, MACD, and Bollinger Bands provide an excellent foundation for understanding how technical analysis works.
Remember that indicators are not crystal balls. They are decision-support tools that work best when combined with sound risk management, market structure analysis, and disciplined execution.
Previous Lesson
Next Lesson
- Technical Analysis vs Fundamental Analysis in Forex


